


Effective AI Overview tracking requires monitoring a defined query set at a fixed weekly cadence, recording citation sources historically, and detecting competitive shifts before they consolidate. Google Search Console doesn't isolate AI Overview clicks, and standard rank trackers measure organic position, not citation presence. This guide covers how to build a query set, establish a baseline, track competitive citation shifts, connect visibility data to traffic impact, and distinguish a Google-side change from a content-side failure.
Manually checking whether you appear in AI Overviews is not tracking. It's a snapshot of one query, on one device, at one moment, and by tomorrow, the citation could be someone else's.
The problem isn't effort. SEO teams are checking. The problem is that manual spot-checks, GSC position data, and traditional rank trackers are all measuring something adjacent to AI Overview visibility, not the thing itself. A page can hold position one in organic results and be completely absent from the AI Overview above it. GSC will show you the traffic consequence of that absence weeks after it happens, with no explanation of what changed or why. And a manual check on Tuesday tells you nothing about what appeared on Wednesday, in another country, for a slightly different phrasing of the same query.
Based on Omnia's proprietary citation database tracking 42M+ citations across four AI engines, only 18.5% of AI Overview answers keep the same top-cited domain week over week. That means for more than 80% of queries, the citation landscape is actively shifting, and most SEO teams have no record of it. This guide builds the tracking system that changes that: what to monitor, at what cadence, how to connect citation data to traffic impact, and how to distinguish a Google-side change from a content-side failure.
Why your current tools miss AI Overview ranking shifts
SEO teams aren't ignoring AI overviews. They're measuring them with tools built for a different problem. Three categories of tools dominate most SEO stacks right now, and none of them captures what actually changes inside an AI Overview.
Google Search Console doesn't isolate AI Overview clicks
There is no AI Overview segment in the default interface, no dedicated report, and no filter that separates clicks coming from an AI Overview citation from clicks coming from a standard organic result. What GSC shows is the aggregate: impressions, clicks, and CTR at the query level, with no indication of which surface generated the signal. That means a page can lose its AI Overview citation entirely and show nothing in GSC until the traffic drop is already several weeks old. By the time the data surfaces, the question isn't "are we losing ground?" It's "how long have we been losing it?" GSC is not built to detect AI Overview losses. It will show you the consequence, not the cause.
Traditional rank trackers measure the wrong layer
Position tracking tools report where a page ranks in the organic index. AI Overviews are a citation layer that sits above that index, not a position within it. A page can hold position one for a query and be completely absent from the AI Overview appearing above it for that same query. These are separate surfaces that require separate measurement. Tracking position 1 and tracking AI visibility inside an AI Overview are not the same measurement — they never were. A rank tracker that shows a stable position 1 while an AI Overview cites a competitor three spots below is giving the reader accurate information about the wrong thing.
Manual spot-checking breaks at any meaningful scale
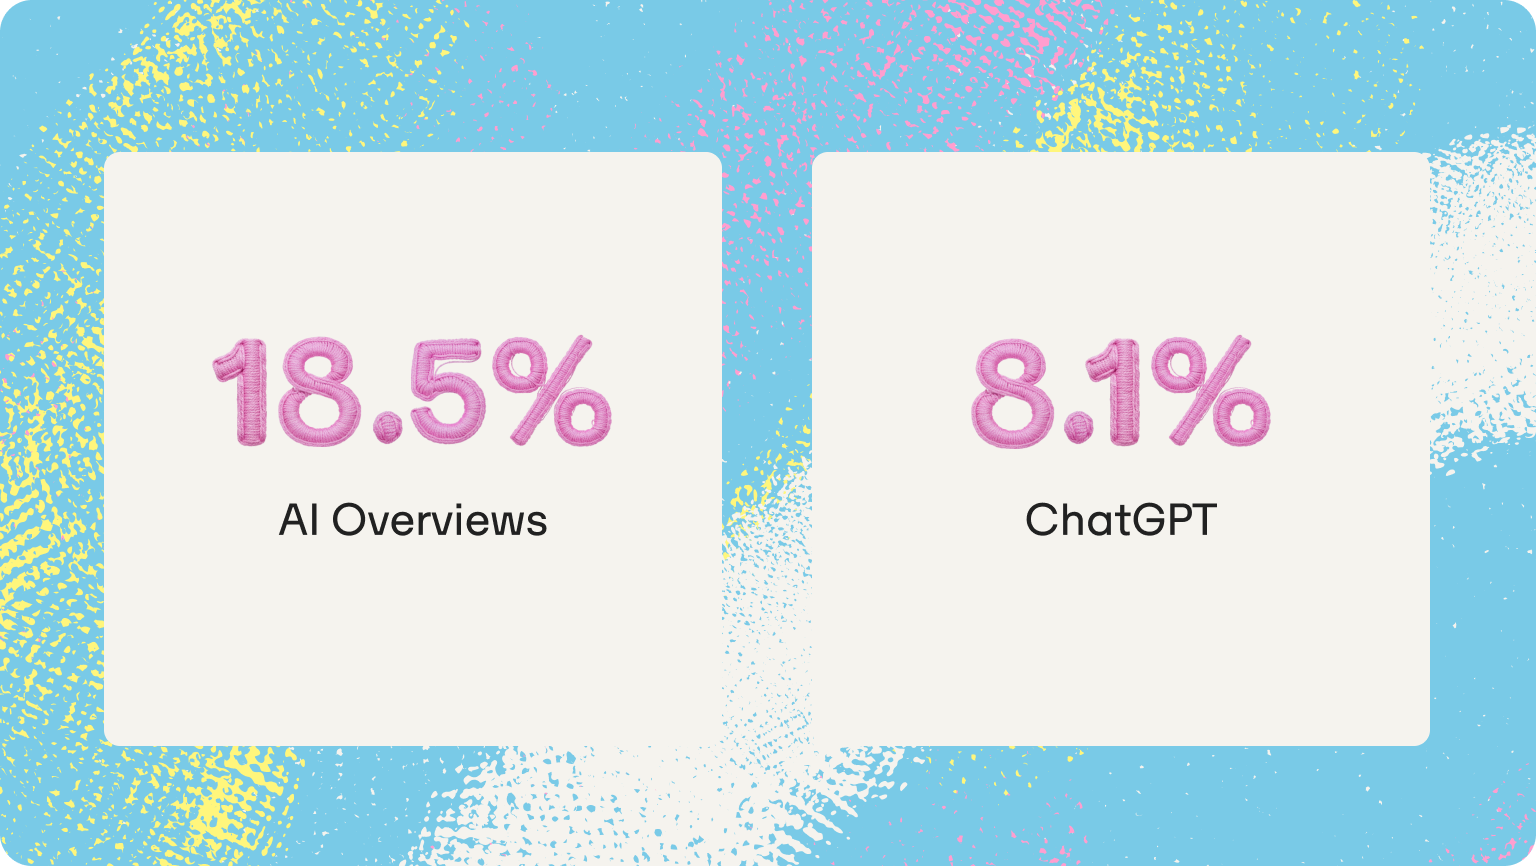
This failure runs deeper than a bandwidth problem. Research from Graphite.io found that AI engines generate different responses to identical prompts because randomness is built into how large language models produce text. A single manual check doesn't capture a fixed state — it captures one draw from a probability distribution. The data confirms how significant that variation is: based on Omnia's proprietary citation database tracking 42M+ citations, only 18.5% of AI Overview answers keep the same top-cited domain week over week. For ChatGPT, that figure drops to 8.1%. At 30 or more tracked queries with two or three competitors in scope, manual checking consumes hours per week and still produces data that can't be trended, compared, or reported. Most teams that start with manual checks abandon the process within a month because the method doesn't scale.
What accurate AI Overviews tracking actually requires
Before any tool is introduced, it helps to be precise about what the tracking system needs to produce. Three components are non-negotiable. Remove any one of them and what remains is observation, not measurement.
Query-level visibility tracking
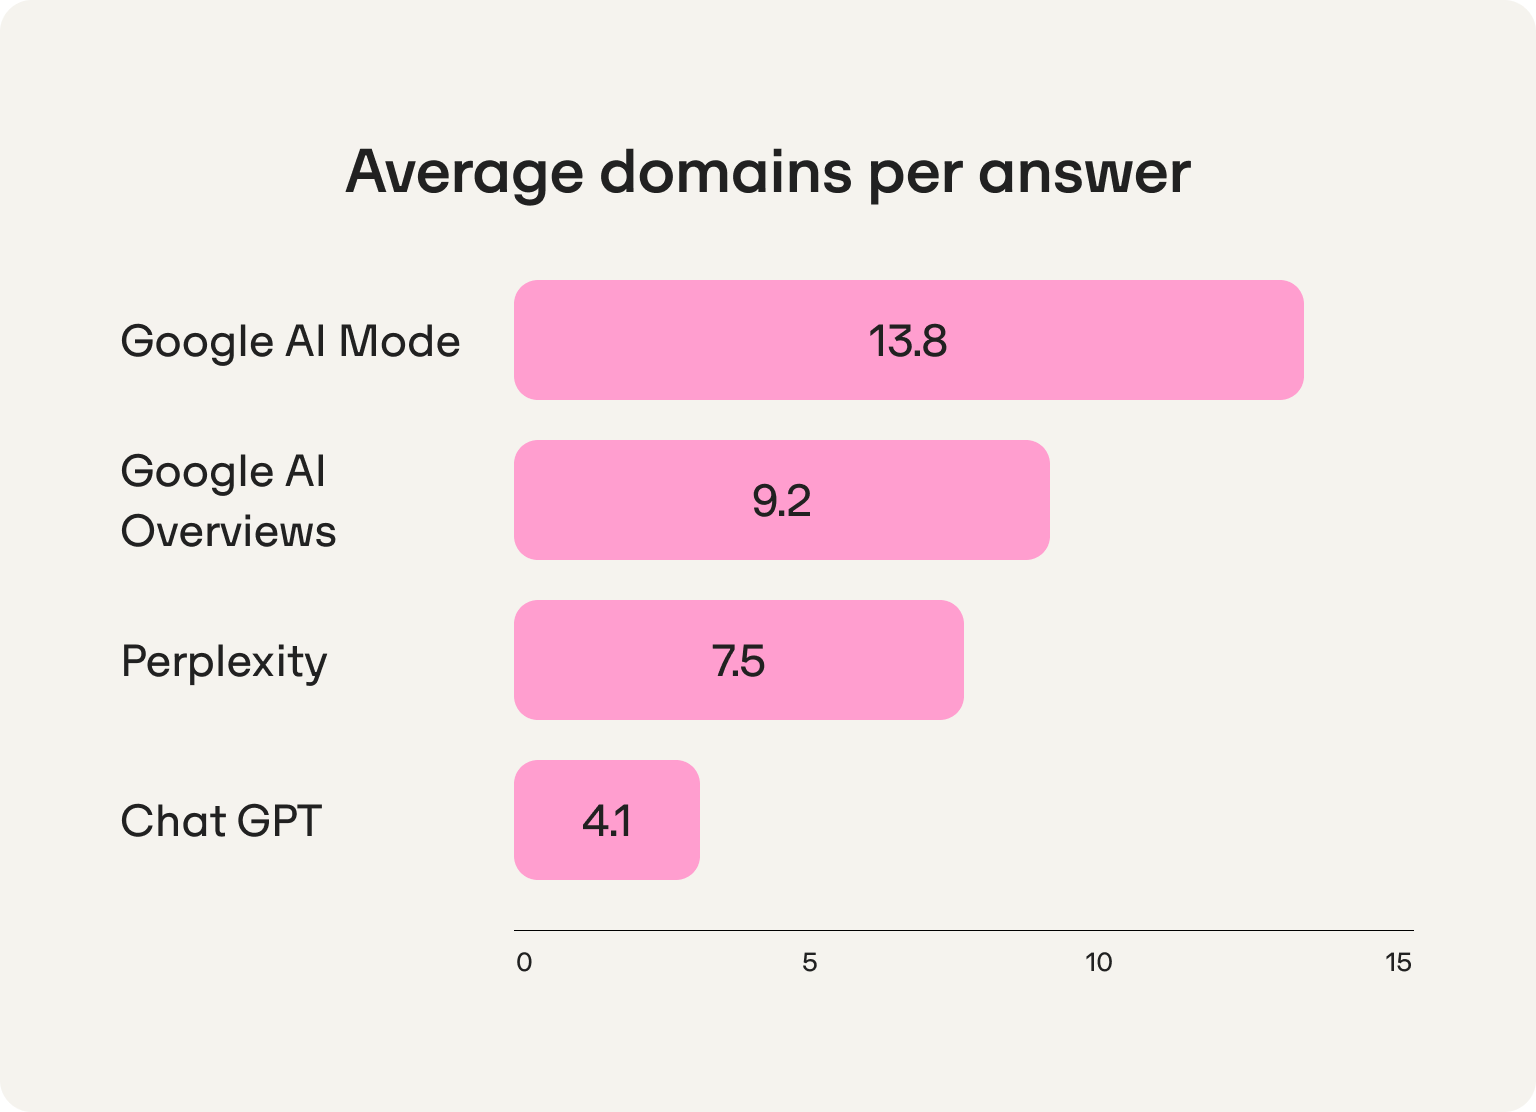
AI Overviews appear per query, not per domain. A brand might be cited for one variation of a high-intent question and absent for a semantically similar one. Tracking requires monitoring a defined set of queries — not just branded queries, but category queries ("best [product type] for [use case]"), comparison queries ("brand vs. competitor"), and high-intent informational queries in the reader's topic space. The stakes of getting this right are concrete: based on Omnia's citation database, AI Overviews cite roughly nine unique domains per answer, and that figure has been stable since Q4 2025. Those are nine slots per answer, distributed across the query set. Without a defined set of queries to track, the reader has no way of knowing which slots they hold, which they've lost, and which a competitor is quietly consolidating. Every check is an isolated observation with no baseline and therefore no measurement.
Historical tracking over time
A single observation is not data. A record of observations over weeks is. The tracking system needs a dated log of when the brand was cited, when it disappeared, and when competitors entered or exited — for each tracked query, week over week. This is what makes it possible to connect a content change to a visibility shift and to distinguish a Google update from a content-side failure. A Google update can affect many queries simultaneously and appear as a cluster-wide shift in the historical record. A content-side failure affects a specific query or cluster and correlates to a publishing or update action. Without historical records, that distinction is invisible and the reader cannot answer leadership's most basic question: "Is this getting better or worse?" For a closer look at how source trust signals for AI factor into why citations shift at the domain level, and what content changes can influence that, the guide on how to improve visibility in Google AI Overviews covers the content-side response in detail.
Competitive citation tracking
For any query where the brand is absent, a competitor is present. Knowing which domains and pages are being cited in its place is not supplementary information — it's the diagnostic that determines what kind of response is needed. It tells the reader whether they face a content gap (the topic isn't covered at the depth the AI model prefers), an authority gap (the cited domain carries more source trust signals for this query type), or a distribution gap (the content exists but isn't placed on the domains AI models read for this topic). Tracking citation share and share of voice across the tracked query set is what converts presence monitoring into competitive intelligence.
How to set up AI Overview tracking across queries, updates, and competitors
The methodology in the previous section defines what to measure. This section defines how to build the system that measures it. The five steps below are sequentially dependent — each one gates the next. Running step three without step two produces data with no reference point. Running step five without step four produces competitive intelligence with no page-level precision.
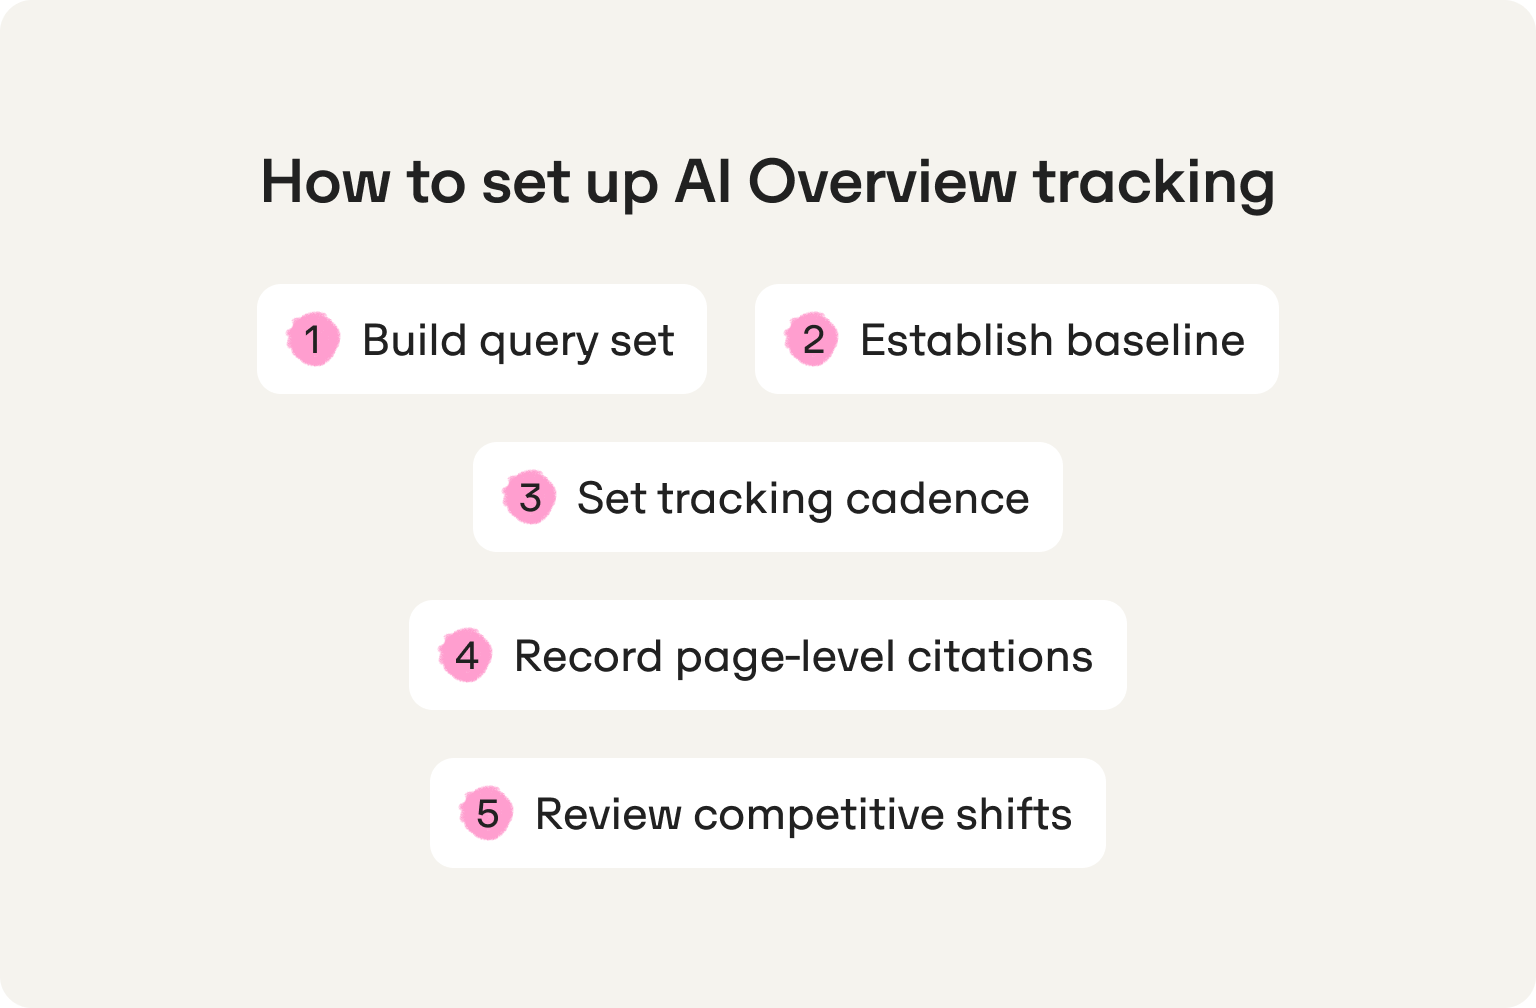
Step 1: Build your query set before you track anything
The query set is the foundation of the entire tracking system. Tracking 200 queries without strategic logic produces noise. Tracking 40 queries with clear categorization produces signal.
Start with 30–50 queries spanning four categories. Branded queries cover the company name combined with a category or use case. Category queries cover the broader topic space ("best [product type] for [use case]"). Comparison queries cover direct competitive pairings ("brand vs. competitor"). High-intent informational queries cover the questions buyers ask before they reach a product page — the "how to," "what is," and "which" queries that sit above the decision.
Prioritize two types of queries within that set: queries where AI Overviews already appear consistently, and queries where the brand holds strong organic rankings. The first group shows where the citation competition is active. The second group shows where AI displacement is most likely to be eroding an existing traffic asset — a page that ranks well in organic but is losing the click to an AI Overview above it.
In practice: a 40-query set documented in a shared sheet, with query type labeled and AI Overview presence confirmed, is more useful than 400 queries without categorization. The query set defines the ceiling of what the tracking system can tell you. Build it deliberately before running a single check.
Step 2: Establish a dated baseline
Without a baseline, there is no measurement. Every future week's data is only meaningful in relation to a fixed reference point, and that reference point has to be established before any content changes, updates, or competitive responses are made.
For each query in the set, record the following at a fixed time and from a consistent location: does an AI Overview appear? Is the brand cited? Which specific page is cited? Which competitor domains appear? This baseline is the zero point. Every subsequent week's data is measured against it, not against last week, but against this original state.
Two things make a baseline reliable. Consistency of conditions: the same device, the same location, the same time of day, with a new session for each prompt as Graphite.io's research recommends, to avoid memory or personalization effects skewing the result. And completeness: a baseline with gaps in the competitor columns is a baseline that will produce ambiguous data later, when a competitor appears and it's unclear whether they're new or were simply not recorded.
If the baseline is missing, the reader cannot tell whether week four is better or worse than week one. They can only describe week four.
Step 3: Set a tracking cadence tighter than the publishing schedule
If the reader publishes a piece of content and checks citation performance a month later, they cannot attribute the result to that piece. Something else changed in the intervening weeks. The cadence must be close enough to the action to detect the signal.
Weekly tracking is the minimum viable cadence for detecting trends. It aligns with how citation patterns actually shift — Omnia's data shows that the citation landscape changes meaningfully at the weekly level, not the monthly one. Daily tracking is needed during active experiments: publishing new content, updating existing pages, or building off-site citations through third-party placements. During a controlled experiment, daily checks for the first two weeks give enough data to determine whether the action produced a signal before the next publishing cycle begins.
In practice: a weekly snapshot of citation status across the full query set, with a change flag for any query that gained or lost a citation since the prior baseline, is the minimum output the system needs to produce. Anything less frequent turns the tracking system into a monthly report — useful for leadership, but too slow to inform content decisions.
Step 4: Record which page is cited, not just whether the brand appeared
Brand presence and page-level citation are different signals, and conflating them is one of the most common tracking errors. An AI Overview can reference a brand by name in generated text without linking to any of its pages. That mention generates no traffic signal, reinforces no specific page as a trusted source, and contributes nothing to the pattern that AI models use when selecting citations for future answers. The cited inclusion rate, which relates to how consistently a specific page is pulled as a source, is a fundamentally different metric from brand mention frequency.
For each citation, record the specific URL cited (not the domain, the exact page), the content type (product page, blog post, third-party article, data source, press coverage), and where in the overview the citation appears and whether as a primary source or a supporting reference. Over time, this record tells the reader which content formats AI Overviews prefer for each query type, whether citations are direct to brand-owned pages or mediated through third-party sources, and which pages are building citation consistency vs. appearing intermittently.
That last distinction matters. A page cited consistently across five weekly checks for a high-intent query reflects model confidence in that source. An intermittent citation reflects a contested slot and one that can potentially be won with a targeted content or distribution response. Knowing the difference determines where to act first.
Step 5: Review competitive shifts weekly, not monthly
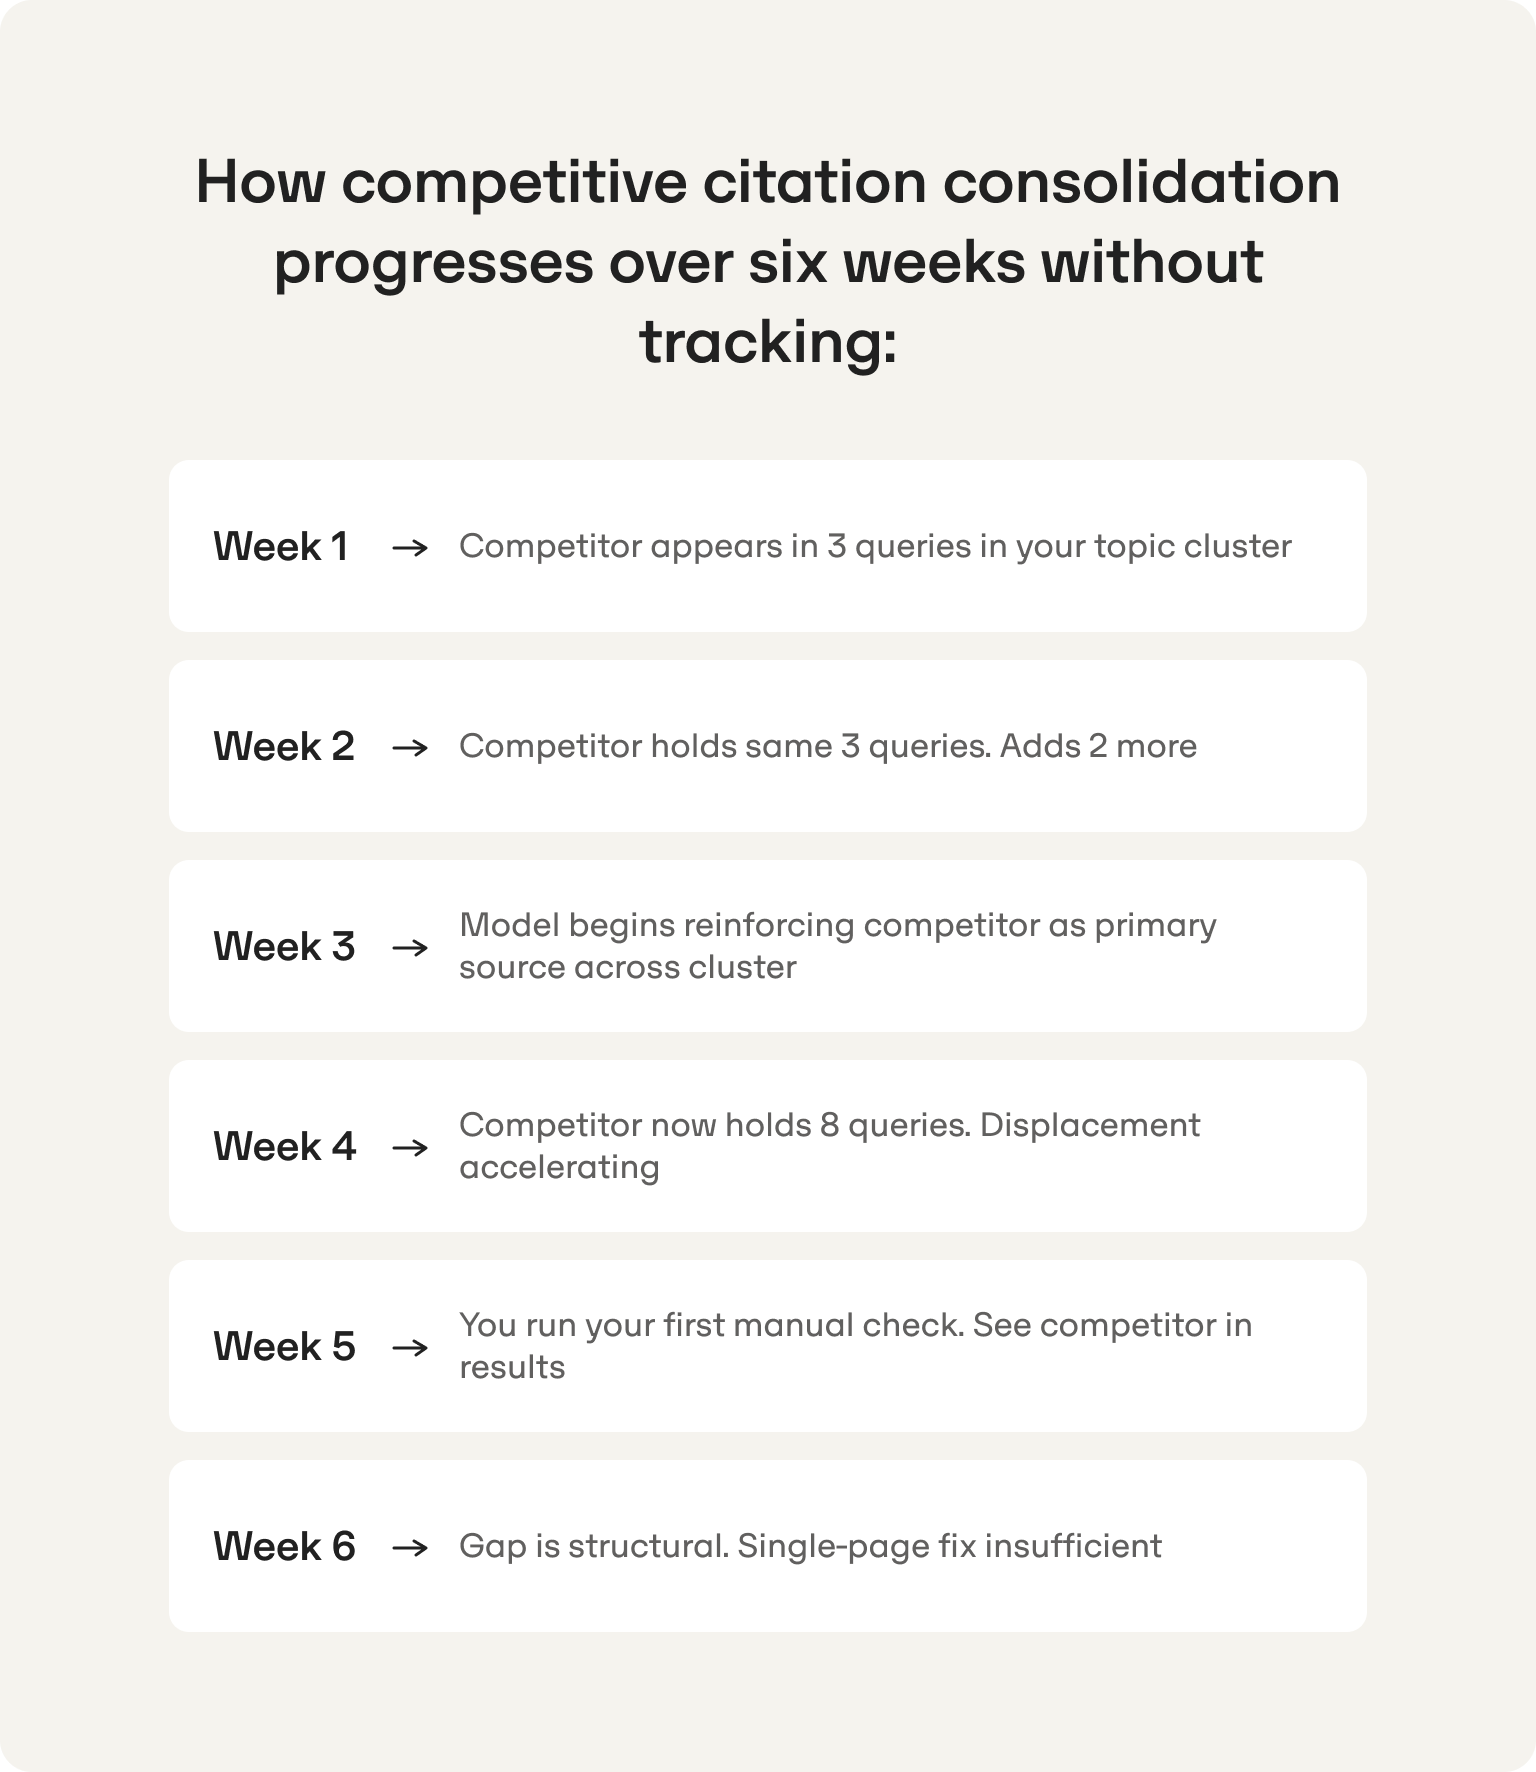
Competitive position in AI Overviews consolidates faster than most SEO teams expect. A competitor that captures consistent citation across a query cluster for six weeks becomes structurally harder to displace because the model's pattern reinforcement works against the reader, not for them. Monthly competitive review means the reader is always six weeks behind that consolidation when they finally see it.
For each query where the brand is absent, record the competitor domain and the specific page being cited. Then look for one of two patterns. Topical consolidation: the same competitor appears across a cluster of related queries, suggesting they have built depth in that topic area that the reader's content doesn't yet match. Fragmented competition: different competitors appear for different queries within the same cluster, suggesting the field is open and early, consistent coverage can establish a foothold.
These two patterns require different responses. Topical consolidation by a single competitor is a structural problem that requires a content cluster response — not a single-page fix. Fragmented competition is an opportunity to move first on the queries that matter most before any one competitor establishes the same consolidation. Tracking competitive AI visibility at this level of granularity is what separates a tracking system that produces decisions from one that produces reports.
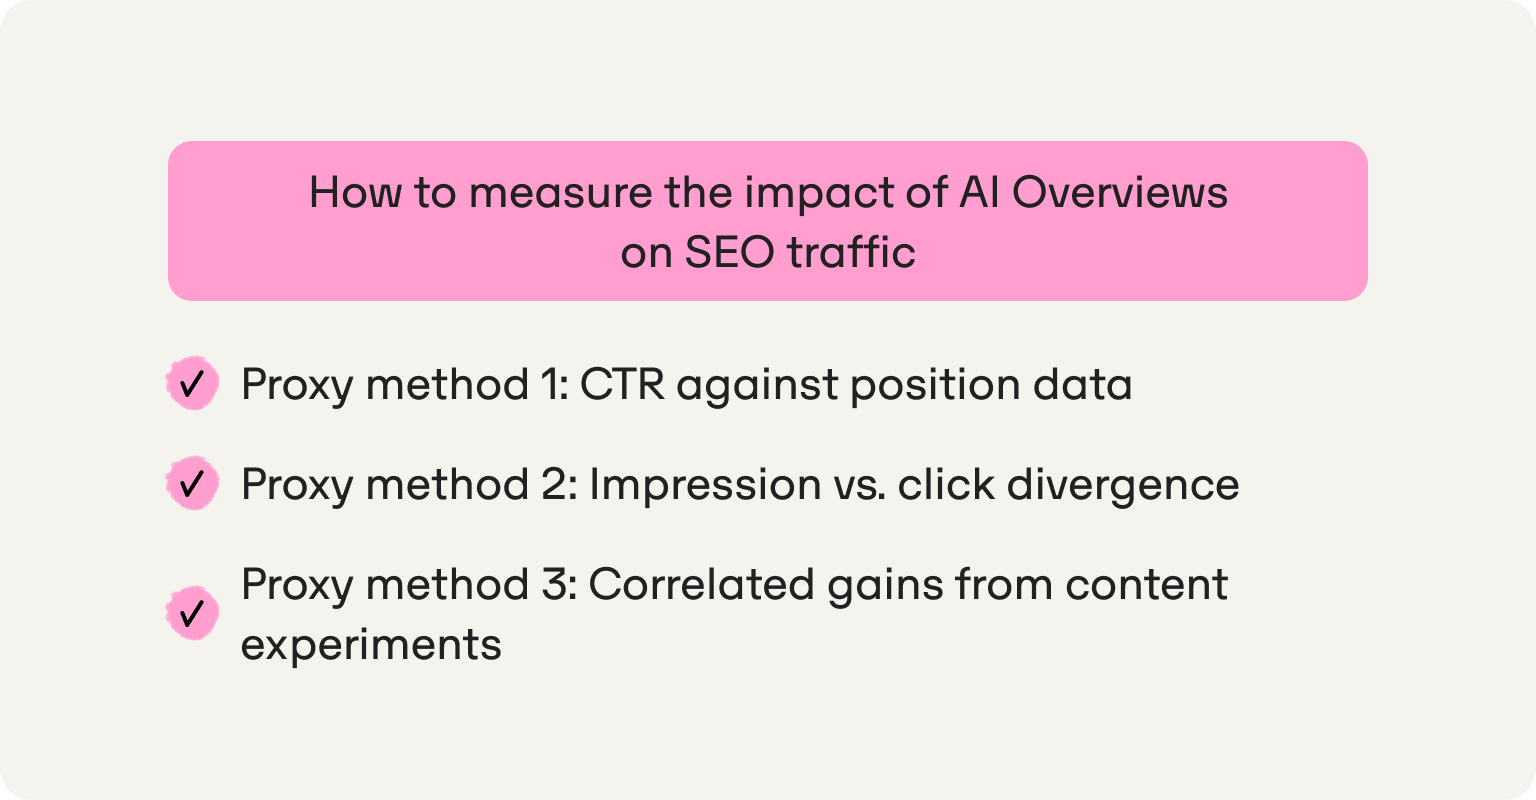
How to measure the impact of AI Overviews on SEO traffic
This is where most SEO leads hit a wall. The tracking system built in the previous section tells the reader what happened in AI Overviews. What it can't do — and what no tool currently does cleanly — is produce a direct attribution line between AI Overview citation and organic traffic. That limitation needs to be stated plainly before the proxy methods are introduced, because building a leadership narrative on a measurement that doesn't exist will eventually backfire.
Google Search Console does not isolate AI Overview clicks. There is no filter, no segment, and no dedicated report that separates traffic arriving from an AI Overview citation from traffic arriving from a standard organic result. This is not a workaround problem. There is no clean solution in GSC today. What follows are three proxy methods that produce meaningful signals.
Proxy method 1: CTR against position data
A page that holds a stable ranking position (position one or two) but shows declining CTR over a 60–90 day window, in a query cluster where AI Overviews are confirmed to be present, is experiencing AI displacement. The position held. The click went to the AI Overview above it. This is the most reliable signal available in GSC without purpose-built tracking. To pull it: filter by query cluster, confirm which queries in that cluster have active AI Overviews using the tracking system from the previous section, and compare CTR period over period for those queries against equivalent queries in the same cluster where AI Overviews don't appear. The gap between those two CTR trends is the displacement signal.
Proxy method 2: Impression vs. click divergence
If impressions for a query hold steady but clicks fall, the page is appearing in the index but losing the click to the AI Overview above it. This is distinct from a rankings drop. Cross-reference query-level impression data against the citation tracking records to confirm which queries are showing this pattern. Queries where impressions are stable, clicks are declining, and the AI Overview tracking system shows a competitor cited in the reader's place are the highest-priority targets for a citation recovery response. This divergence pattern is also worth tracking over time as a proxy for AI impression share, which is the portion of available AI Overview appearances the brand is failing to capture.
Proxy method 3: Correlated gains from content experiments
If the reader gains AI Overview citation for a query cluster and sees CTR or clicks improve in GSC for that same cluster within two to four weeks, that correlation is meaningful. It won't satisfy a finance team's attribution standard, but it gives the SEO lead a reportable narrative: the citation gain preceded the traffic recovery. Run this as a controlled experiment: one query cluster at a time, with the baseline documented before the content change, and the GSC comparison pulled at a fixed interval after. Over several cycles, a consistent pattern of citation gain correlating with CTR improvement is a defensible business case for the channel.
Don't wait for a traffic drop to start tracking. By the time Search Console surfaces the signal, months of citation ground have already been lost and along with months of compounding competitive position to whoever took that place in the AI Overview.
Framing this for leadership
The question SEO leads get asked isn't "did AI Overviews hurt us?" It's "can you show me what changed and what we did about it?" The measurement system doesn't need to produce clean attribution to answer that question. It needs to produce a before and after on citation presence, a trend line showing direction of travel, and a correlation between content actions and GSC signals. That's a reportable narrative. A team running manual spot-checks has a guess. A team running a structured citation tracking system has a case.
How to track AI Overview citations specifically
Presence tracking and citation tracking are related but they are not the same exercise, and conflating them is expensive. Presence tracking answers one question: does the brand appear somewhere in this AI Overview? Citation tracking answers a harder one: is the brand being pulled as a source, which specific page is being cited, and how consistently does that citation hold across time?
The difference matters because two brands can both appear in an AI Overview for the same query and be in completely different competitive positions. One is cited as a source — their URL is linked, their page is pulled as a reference, and that signal compounds over time as the model reinforces that source for that query type. The other is mentioned by name in the generated text, with no link, no traffic signal, and no page-level reinforcement. Only the cited source builds cited inclusion rate over time. Only the cited source generates a click. Most presence tracking systems count both as a win. They are not the same outcome.
The next layer of precision is understanding owned vs. earned mentions — whether a brand appears because its own pages are cited directly, or because a third-party source references it. A brand cited through a G2 review or a Forbes article is visible in the AI Overview, but the traffic goes to G2 or Forbes, not to the brand. The brand's pages gain nothing from that appearance in terms of traffic or citation pattern reinforcement. Knowing which type of citation the brand holds, query by query, determines the right response: fix the owned citation, or build more earned placements.
What to record for each citation. For citation tracking to produce decisions rather than observations, four data points are needed for each cited instance. The specific URL cited — not the domain, the exact page, because a product page citation and a blog post citation for the same query signal different things about what content format the model prefers. The content type: product page, blog post, comparison article, third-party review, data source, or press coverage. The position within the overview: whether the page appears as the primary source anchoring the answer, or as a supporting reference in a secondary position. And citation consistency: whether the same page appears across multiple weekly checks for that query, or whether it appears intermittently. How answer positioning and answer surface area factor into that consistency is worth understanding before interpreting what the position data means — both concepts inform why the same page can anchor one answer and appear as a footnote in another for a semantically similar query.
Citation stability as a competitive signal. A citation that holds consistently across five or more weekly checks for a high-intent query reflects model confidence in that source for that topic. It's harder to displace and requires either a significant content investment or a structural authority response — building citations to the brand's pages on the domains the model already trusts for that query. An intermittent citation reflects a contested slot. The model is rotating between sources, which means the competitive position is not yet locked. Intermittent citations held by competitors are the prioritized target for content and distribution responses. Stable citations held by competitors require a longer-term authority-building play. Knowing which is which, across the full query set, is what makes prioritization possible rather than arbitrary.
The scale problem. Doing this manually across 50 queries, three competitors, and four data points per citation, every week, is between four and six hours of work for a one-person team — before any content response is written. At that volume, the tracking system itself becomes the resource drain it was supposed to eliminate. This is the operational reality that a purpose-built tool needs to solve, and it's the point at which the methodology the reader has built requires an execution layer to become sustainable.
What to track — and what to stop obsessing over
A tracking system that produces too many metrics produces paralysis. The list below is deliberately short on both sides: the positive list covers what generates decisions, and the negative list covers what generates noise that looks like signal:
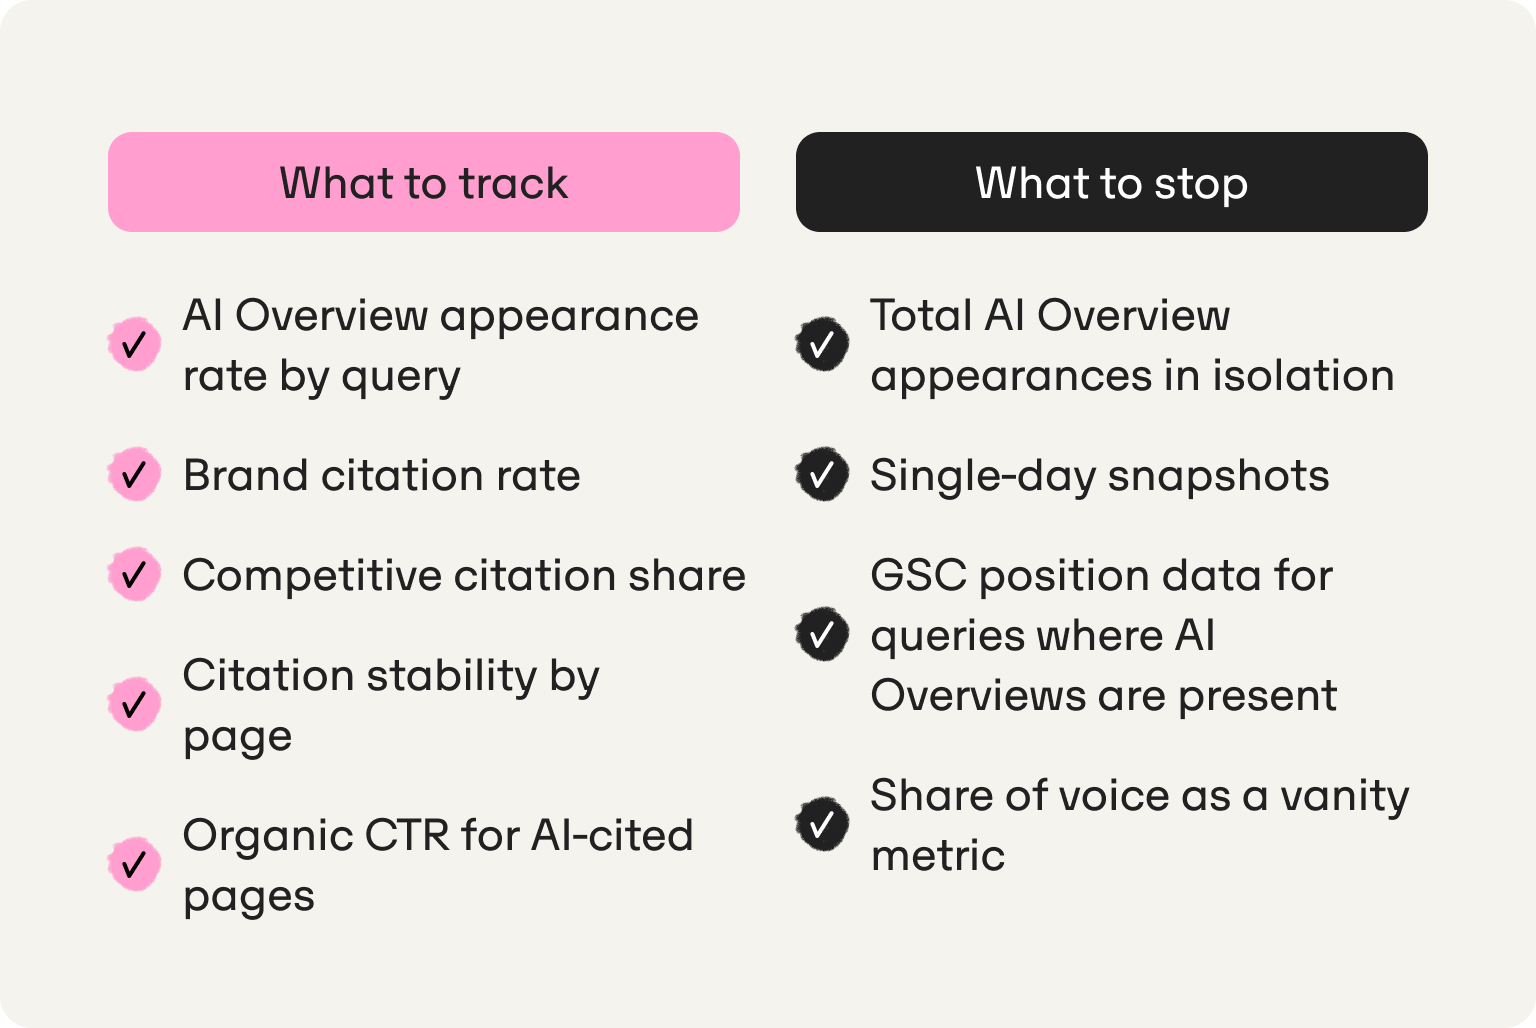
- AI Overview appearance rate by query. What percentage of the tracked query set triggers an AI Overview at all. This fluctuates with Google updates independently of anything the brand does, and it's worth logging separately from citation data so that a drop in overall citation presence can be distinguished from a drop in AI Overview triggering rates. If AI Overviews stop appearing for a query cluster, the citation data for that cluster becomes temporarily uninterpretable.
- Brand citation rate. What percentage of AI Overviews in the tracked set cite the brand in a given week, expressed as a weekly figure rather than a cumulative one. This is the primary performance metric that tells the reader whether the system is working, and the number that goes into the leadership report.
- Competitive citation share. Which competitors appear across the tracked query set, how many queries each competitor holds citations on, and how that distribution shifts week over week. A competitor gaining citation share across a topic cluster over three or more consecutive weeks is a consolidation signal that requires a content response, not a monitoring note.
- Citation stability by page. How consistently a specific page is cited across weekly checks for each tracked query. Pages building stable citation patterns are working assets. Pages with intermittent citations are contested slots. Pages with no citation presence despite strong organic rankings are the AI displacement signal. The page is ranking but losing the citation, and therefore losing the click, to a competitor above it in the Overview.
- Organic CTR for AI-cited pages vs. equivalent pages without AI Overview citation. Pulled from GSC for the same query clusters. This is the proxy correlation that builds the leadership narrative. Citation presence correlating with CTR improvement over a 60–90 day window is the closest available approximation of attribution, and it's the metric that answers "is this investment working?"
But stop obsessing over these:
- Total AI Overview appearances in isolation. Without a competitive baseline, knowing the brand appeared in 34 AI Overviews this week tells the reader nothing. Appeared in 34 out of how many tracked queries? Against how many competitors who appeared in more? The absolute number is meaningless without the denominator and the competitive context.
- Single-day snapshots. As Graphite.io's research makes clear, AI engines generate different responses to identical prompts because randomness is built into the generation process. A single-day reading is one draw from a probability distribution. Weekly averages across multiple prompt runs are the reliable unit of measurement. Daily variance is noise unless the reader is running a controlled experiment with enough prompt repetitions to produce a statistically meaningful sample.
- GSC position data for queries where AI Overviews are present. Position 1 means something categorically different for a query where an AI Overview sits above it and absorbs the click than it does for a query where organic results appear first. Treating position 1 as a consistent performance signal across both query types produces a misleadingly positive picture of organic performance. Segment the two query types before drawing any conclusions from position data.
- Share of voice as a vanity metric. Share of voice is a meaningful strategic metric when computed across a deliberately built query set with competitive context. It becomes a vanity metric when reported as a single aggregate number across all queries, including queries where AI Overviews don't appear, where the brand holds no organic presence, or where the query set hasn't been validated for relevance. Build the query set first, then compute share of voice within it.
Why tracking AI Overviews is the SEO team's most urgent unmeasured channel
SEO leads are accountable for organic traffic and organic revenue. They have a content operation running: briefs, publishing cycles, optimization schedules. What most don't have is visibility into whether any of that work is reaching the surface where an increasing share of buyers are now making decisions. That's the gap this section closes.
The compounding problem. AI Overview citations are not neutral ground. The more consistently a competitor is cited for a query cluster, the more the model reinforces that source as the trusted reference for that topic. Based on Omnia's citation database tracking 42M+ citations across four AI engines, only 18.5% of AI Overview answers keep the same top-cited domain week over week, which means the citation landscape is actively shifting for more than 80% of tracked queries. Every week without a tracking system is a week where that shifting happens without detection. The reader cannot close a gap they cannot see, and they cannot see it without a dated record that shows when it opened and how fast it is widening. Competitors who establish consistent citation presence across a topic cluster over six weeks become structurally harder to displace. The consolidation compounds in their favor, not the reader's.
The leadership problem. SEO leads are under pressure to demonstrate that organic search is not dying. The answer to that pressure is not a position report. A team that can show its AI Overview citation rate improving week over week, correlated with CTR recovery in GSC, has a reportable narrative. A team running manual spot-checks has a guess. The question leadership actually asks is not "did AI Overviews hurt us?" It is "can you show me what changed and what we did about it?" That question requires a before and after on citation presence, a trend line showing direction of travel, and a correlation between content actions and GSC signals. None of that is available from Search Console alone, and none of it is producible from a manual checking process. The ability to defend the organic channel to leadership depends on having data that Search Console does not provide.
The action problem. Tracking without execution is still a dashboard. The value of an AI Overview tracking system is not the data it produces. It is the decisions that data forces: which queries to prioritize, which existing pages to update, which competitors to study, which content gaps to close. A tracking system that produces a weekly list of those decisions is worth running. One that produces a chart is not. Don't wait for a traffic drop to start. By the time Search Console surfaces the signal, months of citation ground have already been lost to whoever took that place in the AI Overview, and months of compounding competitive position have consolidated against recovery.
Omnia is built as the operational answer to all three problems. It produces the historical record that makes the compounding gap visible before it locks in. It surfaces the competitive data at the query and page level, so users know not just that they are losing ground but to whom and via which specific content, which is the information that turns a tracking report into a reportable leadership narrative.
And it connects every citation gap to a content action, so the system produces decisions rather than observations.
Book a demo to see how Omnia tracks AI Overview visibility for your query set, or get started and run your first citation audit today.
FAQs
Does Google Search Console show AI Overview performance?
No. GSC does not isolate clicks or impressions from AI Overviews. There is no segment, filter, or dedicated report that separates AI Overview traffic from standard organic traffic. The only proxy available is CTR decline against a stable ranking position in a query cluster where AI Overviews are confirmed to be present, which signals displacement without directly attributing it. Omnia tracks AI Overview citation presence directly, producing the signal GSC cannot.
How often do AI Overview citations change?
More often than most SEO teams expect. Based on Omnia's citation database, only 18.5% of AI Overview answers keep the same top-cited domain week over week, meaning the citation landscape is actively shifting for more than 80% of queries. Research from Graphite.io confirms the mechanism: randomness is built into how large language models generate text, so different responses to the same prompt are the norm, not the exception. Weekly tracking is the minimum viable cadence for detecting meaningful trends rather than daily noise.
Can I track AI Overview rankings with a standard rank tracker?
No. Standard rank trackers report position in the organic index. AI Overviews are a citation layer that sits above the organic index, not a position within it. A page can hold position 1 in organic results and be completely absent from the AI Overview appearing above it for the same query. These are separate surfaces that require separate measurement. For a detailed breakdown of what rank tracking tools built specifically for AI Overviews actually measure and where standard trackers fall short, that comparison covers the distinction in full.
What's the difference between tracking AI Overview presence and tracking AI Overview citations?
Presence tracking records whether a brand appears anywhere in an AI Overview, including as a text mention in the generated answer. Citation tracking records whether a specific page is linked as a source, which content type was cited, where it appears in the overview, and how consistently it holds across weekly checks. Only cited pages generate traffic signals and build citation pattern reinforcement over time. A brand can appear in an AI Overview regularly and still generate no traffic from it if the appearances are text mentions rather than source citations. The distinction between owned vs. earned mentions and direct citations is what determines whether AI Overview presence is actually a growth asset.
How do I tell whether a drop in AI Overview visibility is a Google update or a content problem?
The diagnostic is in the pattern. A Google update affects many queries simultaneously and appears as a cluster-wide shift in the historical tracking record, often across topic areas that have no direct relationship to each other. A content-side failure affects a specific query or cluster and correlates to a publishing action, a page update, or a competitor's new content. Without a dated historical record, both look identical: a drop with no explanation. With weekly tracking across a defined query set, the two causes produce visibly different patterns. This is one of the primary reasons historical tracking is non-negotiable in a properly built system.
How many queries should I track for AI Overview visibility?
Start with 30–50 queries spanning four categories: branded queries, category queries, comparison queries, and high-intent informational queries in the topic space. Prioritize queries where AI Overviews already appear consistently and queries where the brand holds strong organic rankings, because those are the surfaces most likely to show AI displacement first. For guidance on how prompt research differs from traditional keyword research in determining which queries belong in the set, that knowledge base entry covers the selection methodology in detail. A 40-query set with clear categorization produces more actionable signal than 400 queries without strategic logic.
How do I track AI Overview performance for SEO reporting to leadership?
Build the report around three outputs rather than a single metric. First, brand citation rate as a weekly percentage of the tracked query set: the primary trend line that shows direction of travel. Second, competitive citation share across the same query set: which competitors hold how many citation slots, and how that distribution is shifting. Third, the proxy correlation between citation gains and CTR improvement in GSC for the same query clusters over a 60–90 day window. Together these three outputs produce a before and after on citation presence, a competitive narrative, and the closest available approximation of traffic attribution. That is a reportable case for the channel even without clean attribution from Search Console. For a closer look at how GEO vs SEO framing affects how this reporting lands with leadership teams that are still primarily oriented around traditional search metrics, that knowledge base entry covers the positioning in detail.